
3 minutes
Match likely durations of deposits and assets as part of ALM modeling.
One of the most relevant issues involving the funding side of your balance sheet is determining how to effectively deploy non-maturity deposits, or deposit accounts with no stated maturity, to fund assets by roughly matching holdings on both sides of the balance sheet.
Yes, I’m aware that non-maturity deposits are already being used to fund the asset side of the balance sheet. But if funding management is aimed at funding the asset side of the balance sheet with liabilities with similar interest rate risk characteristics at the lowest funding cost, then we need to determine which assets non-maturity deposits can effectively support. This issue has grown in importance in recent years as non-maturity deposits now represent 60 percent to 80 percent of deposit funding in many institutions.
The first step in this exercise is to complete a core deposit study. Out of that study come pricing betas to help estimate how market rate changes will affect credit union rates, decay rates and surge balance estimates of the potential for sudden changes in deposits for your non-maturity deposits. Then you plug these assumptions into your asset-liability model. The portion of your net economic value analysis report that focuses on the categories of non-maturity deposits might look like the following “Market Values by Rate Shock” table in Figure 1.
FIGURE 1
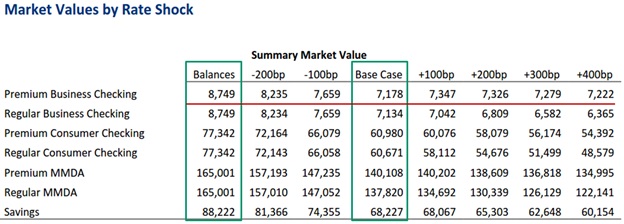
Book values are in the left column. Market values for the current rate environment are listed in the Base Case column. Changes in market values for rate shocks ranging from -100 bp to +400 bp are in the remaining columns. Market values are calculated by using decay rates to project principal cash flows and pricing betas to project interest cash flows. Cash flows are then marked to market. Ideally, disappearance of surge balances in rising rate environments will accelerate decay rates in those environments.
From this chart we can calculate effective durations of the various categories by dividing the percentage change in market values by the change in market rates:
Deff = -Chg MV / Chg MR
If surge balances are separated from the balances that are core, the effective durations of the core balances might appear as in Figure 2.
FIGURE 2
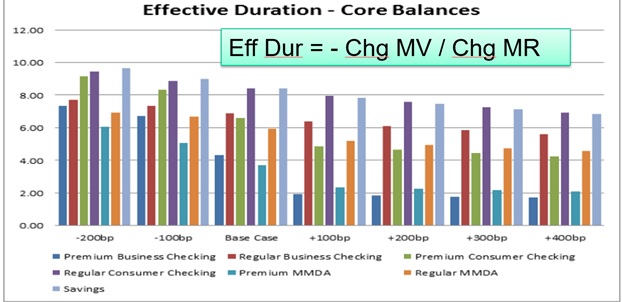
As you can see from this graph, the effective duration of the various core deposit categories in rising rate environments runs from just under two years to as high as eight years. You might be asking, “What assets have similar durations?”
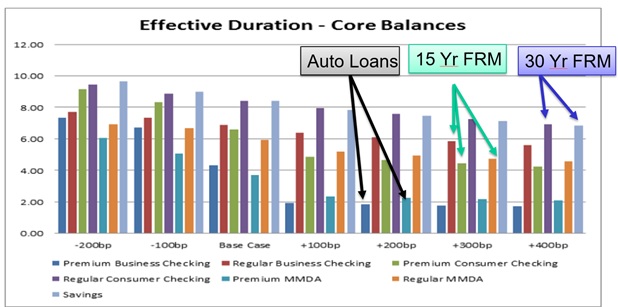
- Non-maturity deposits with a duration of around two years (premium business checking and premium money market deposit account) have high betas and respond relatively quickly to changes in market rates in the institution being studied. Auto loans have durations between 1.5 and two years. So it would appear these deposit categories might be an ideal funding source for auto loans.
- Non-maturity deposits with a duration between four and six years (regular business checking, premium consumer checking and regular MMDA) have moderate betas, responding moderately to changes in market rates. Fifteen-year, fixed-rate mortgages, five-year balloons and seven-year balloons have similar durations. It would appear as though these deposit categories might be an ideal funding source for these kinds of loans.
- Non-maturity deposits with a duration between six and eight years (savings and regular consumer checking) have very low betas, responding slowly to changes in market rates. Twenty- and 30-year, fixed-rate mortgages have similar durations. It would appear as though these deposit categories might be an ideal funding source for these kinds of loans.
Figure 3 is adapted from Figure 2, with core balances mapped to the assets they could support based on effective duration.
FIGURE 3
The data employed in this illustrative analysis and set of results are for a particular institution. Your results could be different. In addition, there is no guarantee that the past behavior of non-maturity deposits is predictive of future trends. Yet it is useful to begin to discover how various categories of non-maturity deposits might be deployed to support different asset classes. Try it on your NEV report.
Thomas A. Farin is chairman of Farin & Associates, Inc., Fitchburg, Wis.