
5 minutes
Use them to set your CU's direction.
Borrowing from some individuals to make loans to others dates back well over 1,000 years. Credit unions have been doing this cooperatively for nearly 150 years. Despite all the innovations we have seen during our lifetime, the primary principles of running a financial institution today have not changed.
In fact, five main “levers” drive a credit union’s success. How well a board and management team use them will determine whether your CU ultimately stands the test of time. It’s the same test for every CU.
That’s right; whether you are running a trillion-dollar multi-national bank or a $100 million local CU, you can only push or pull five levers to move your institution forward:
- income on assets (yield on loans and investment income),
- cost of funds,
- loan loss provision,
- non-interest income, and
- operating expenses.
It is critical that boards and management teams understand these five levers and how they relate to one another.
Here’s how the five variables work in an equation to determine every financial institution’s bottom line: Net Income = Income on Assets - Cost of Funds - Loan Loss Provision + Non-Interest Income - Operating Expenses.
This article will show you different ways these five levers can be used in setting strategy. First, we’ll examine how PenFed Credit Union compares to nine credit unions of similar asset size. Your board members and executives can see how your levers stack up.
Later, you can compare your five levers and results to those of your peers. The National Credit Union Administration defines peer groups by asset size ranges. Alternatively, each credit union may choose to define its peers based on geography or field of membership.
By understanding all of this, you can shape your strategy and focus on how you want to compete. All of the comparative information is publicly available from NCUA’s quarterly call reports. Going forward, you can update data on the five levers each quarter to chart your progress toward desired goals.
Low-Cost, High-Tech Strategy
The chart below shows how PenFed CU’s five levers look in comparison to nine of its peers.
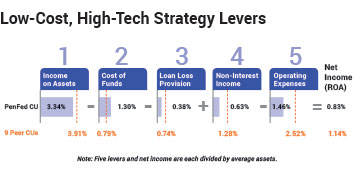
To explain our operating strategy, I’ll begin with the fifth lever, operating expenses. At the end of 2016, our operating expenses were 1.46 percent, whereas the peer group averaged 2.52 percent, a 106-basis-point advantage. This difference is by design. PenFed CU’s strategy is to deliver products primarily through web and mobile technology with relatively few branches.
As a result of this advantage, PenFed CU strives to deliver maximum pricing power to enhance member value in the form of low loan and high dividend rates. Let’s see how these differences look on the first two levers.
PenFed CU’s first lever, income on assets, was 3.34 percent—57 basis points below peers’ yield of 3.91 percent. So on average, our CU charges members significantly less for loans than this group of peers.
On the second lever, PenFed CU’s cost of funds was 1.30 percent—51 basis points above the peer average of 0.79 percent. So PenFed CU members on average earn about half a percentage point more on deposits and pay about half a percentage point less for loans.
Perhaps the loan loss provision, the third lever, is the most complicated to control. This lever is directly related to asset mix and credit quality. Due to a mix of secured lending and credit quality, PenFed CU on average had 36 basis points less loan loss expense than peers.
Looking at the fourth lever, PenFed CU earned only 0.63 percent from fees and charges—65 basis points lower than peers’ average of 1.28 percent. To benefit members, PenFed CU is deliberately offering no or low fees.
Thousands of Strategic Choices
In using the five levers to analyze performance versus peers, CU leaders can focus on how they want to compete to best drive value to members. Using the five levers as a template, they can make choices to best serve their growth strategies.
Different institutions have different strategies in moving the levers toward success, and there are literally thousands of ways to do so. By placing a CU’s data into the five levers, its strategy becomes readily apparent. Doing so also highlights each CU’s advantages and/or challenges. The levers tell the whole story, whether it’s success or failure.
Let’s look at the story of a healthy, growing CU and one that ultimately didn’t survive. How does your CU compare?
Large Branch Strategy
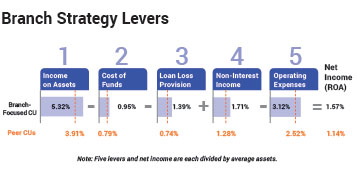 The credit union depicted in the chart at the top of this page has operating expenses of 3.12 percent to support a large branch network. However, it also has income on assets of 5.32 percent, well above peers. NCUA data also shows the credit union does more loans to borrowers with lower credit scores than peers and 100 percent loan-to-value mortgages. In addition, its non-interest income far exceeds peers. Not surprisingly, the CU’s loan loss provision is also well above the peer average.
Yet its strategy is working. Strong earnings support sustained growth and capital. In fact, this credit union has one of the highest asset growth rates among all credit unions.
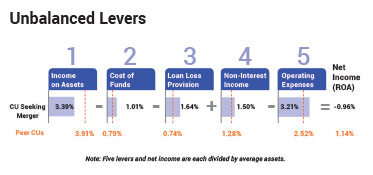
Unbalanced Levers
 The five levers of the CU shown in the second chart on this page were so out of balance, it could not survive on its own. The call report we analyzed turned out to be its final one before merging. Income on assets barely covered operating expenses, a sign of inefficiency. High non-interest income was wiped out by an even higher loan loss provision reflecting poor credit quality. The heavy cost of funds sent net income deeply negative. If you see an institution with its five levers this far out of balance, you know the board and management must quickly change strategy or seek a merger partner.
What’s Your Strategy?
Using the five levers to set your strategy and benchmark your CU will help ensure you are executing your strategy. The numbers don’t lie. They clearly define an institution’s strengths, weaknesses and overall business strategy.
Today and for the next 1,000 years, credit union leaders can use these levers to ensure our cooperatives’ success.
CUES member James R. Schenck, CCD, is president/CEO of $23 billion PenFed Credit Union in Tysons, Va. This article is based on a conference presentation.