
7 minutes
A key strategic ramification of CECL is a disconnect between financials now and later.
Current expected credit loss is capturing a lot of headlines these days. Articles and presentations are focused on the data that will be needed to forecast expected life of loan credit losses under the Financial Accounting Standards Board’s new guideline. While the data component of CECL is important, here we’ll take a look at life under CECL beyond data management.
Because CECL won’t increase loan losses, we often hear that any change in earnings after the one-time adjustment is temporary and “it all evens out.” This is only true if the loan mix stays the same, the level of credit risk doesn’t change, the economic forecast remains stable and loans don’t grow.
At two CECL workshops in summer 2017, our participants, who included representatives of some of the largest credit unions, observed some major takeaways they were not expecting. We’ll examine a key one in this article: “CECL could result in a disconnect between financials and ultimate financial performance.” (Also read “2 More Strategic CECL Concerns.”)
Negative Performance at First
How could loans with a rate of 5.50 percent earn -58 basis points for the fiscal year?
Under CECL, expected credit losses over the entire lifetime of the loans will be set aside when the loans are made. How much income will you earn on the day the loans are made? None, right?
This will create a disconnect between what is seen on the financial statements and what the loans may ultimately be able to contribute once they begin to earn income.
Clearly, the amount of credit losses expected will play a key role in how big this disconnect is for different credit unions. Consider the first two lines (“Loan Rate” and “Lifetime ECL”) in Chart 1, below.
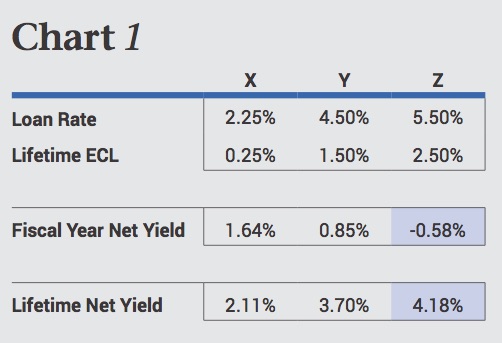 For Example X, loans are made at a low rate of 2.25 percent with a low level of ECL. Example Z shows loans at a higher rate with a higher ECL. Example Y is in the middle. When these loans are made, the credit union will set aside the lifetime ECL, but not collect any income.
Let’s take a look at Example Z in more detail. In it, we are assuming that loans are put on evenly throughout the course of the year, say $10 million a month. So each month, this credit union makes $10 million in Z loans, sets aside the lifetime ECL of $250,000 and does not collect any income on those loans until the next month. Over the course of the fiscal year, the amount of credit loss expense the CU sets aside for the Z loans is greater than the income they earn, resulting in a fiscal year net yield of -0.58 percent (see the highlighted area in Chart 1 on the previous page).
Yes, in the fiscal year they are made, the contribution of these loans to the CU’s financials is negative!
This will be hard for some credit union stakeholders to get their heads around. They may wrestle with understanding how making loans is hurting the financials. This is the disconnect that needs to be understood.
Once the lifetime ECL is set aside, the Example Z loans are poised to earn 5.50 percent for the remainder of their lives for a lifetime net yield of 4.18 percent (see the highlighted figures in Chart 1). Now, this could change if the economic environment is expected to change (a downturn, for example) or if initial credit risk assumptions were off, but setting those aside, these loans will earn 5.50 percent for the rest of their lives.
Lifetime Net Yield
Credit unions will need to get really good at understanding lifetime net yield. For Example Z, looking only at the impact to the financials, a credit union might make the decision to stop making these loans, not realizing that over the life of the loans their contribution to the financials is 4.18 percent.
In Example Z, there is a material disconnect between the financials and ultimate financial performance: -0.58 percent versus 4.18 percent. This will not always be the case. The impact of CECL will be unique to each credit union’s business model.
In Example X, the fiscal year net yield is 1.64 percent and the lifetime net yield is 2.11 percent. There is a difference here, but not like the big disconnect found in Examples Y or Z.
As we pointed out, the amount of credit risk being taken will play a key role in how large the disconnect is. If your credit union takes more credit risk, it may experience a larger disconnect than another credit union that takes less credit risk.
 In the examples above, loans were assumed to be made evenly over the fiscal year. Now, let’s isolate loans made at two different points during the year.
When You Lend
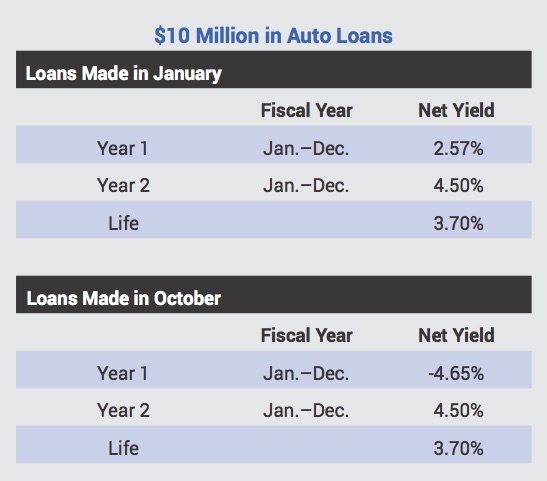
Using our Example X, will loans made in January have the same net yield for the year as loans made in October? No, they will not. The loans made in October only have two months left in the fiscal year in which to earn income, whereas loans made in January have 11 months. In this example, October loans have a negative yield in the fiscal year (see chart at right, “$10 Million in Auto Loans”).
In the adjacent illustration, the loans made in January have a positive 2.57 percent Year 1 net yield while the loans made in October have a -4.65 percent Year 1 net yield. Does this mean the credit union should not make loans in October? Or that the loans made in October are bad loans? No, but it again points out how important it will be to shift your mindset and evaluate financial performance in light of lifetime net yields. For these loans, they are the same at 3.70 percent. The credit union’s financials would favor the January loans, but from an ongoing financial performance perspective, they are the same.
Could this potentially change how credit unions—or other financial institutions—do business? Imagine having a very successful loan promotion near the end of the year, only to have it hurt earnings because the net yield on the promotion was very low or even negative! What are some unintended consequences of this? Do credit unions stop running promotions? Or only run them early in the year? What about banks that have to report to their stockholders? Might they only run promotions early in the year, and could that potentially open up lending opportunities for a credit union that understands the difference between the fiscal year net yield and the lifetime net yield?
The Impact of Growth
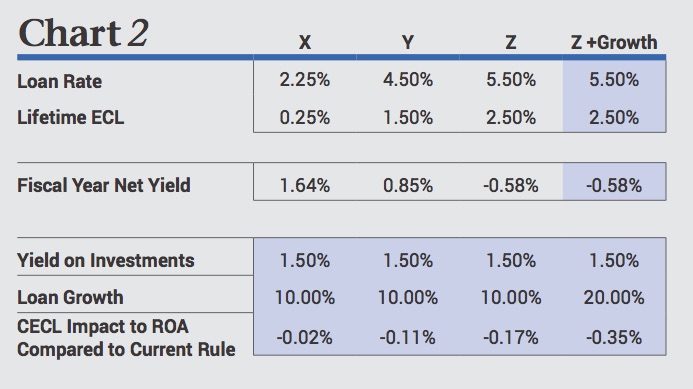
In addition to decreased earnings due to low fiscal year net yields, a growing loan portfolio can add another disconnect. If a credit union is growing loans and the fiscal year net yield on those loans is less than what the credit union could earn on investments, this will actually hurt the credit union’s earnings further. In other words, the credit union’s financial statements would indicate that the credit union would be better off just leaving the money in investments. However, over the long run, keeping the money in investments may not be the best business decision. How much earnings drop depends on how low the fiscal year net yield is, and how fast the credit union is growing loans—the lower the fiscal year net yield and the faster the loan growth, the more it will hurt.
Returning to Examples X, Y and Z, the impact to return on assets from CECL will be different for each. An additional scenario, increasing loan growth on Example Z, has been added to Chart 2.
Again, this is something that will be confusing for many CU executives and boards. Imagine having a great year of lending—and it hurts earnings. Communicating the ongoing financial performance of the organization by understanding lifetime net yield will be key.
c. myers corporation has partnered with credit unions since 1991. The company’s philosophy is based on helping clients ask the right, and often tough, questions in order to create a solid foundation that links strategy and desired financial performance. c. myers has the experience of working with over 550 credit unions, including 50 percent of those over $1 billion in assets and about 25 percent over $100 million. They help credit unions think to differentiate and drive better decisions through real-time ALM decision information, CECL consulting, financial forecasting and consulting, liquidity services, strategic planning, strategic leadership development, process improvement and project management. This article was adapted with permission from “Life After CECL: 3 Strategic Ramifications to Consider,” published in February 2018 at cmyers.com/c-notes.