4 minutes
Go beyond a simple review of interest rates to examine your institution’s ‘true rates’ using product profitability analytics.
Sponsored by Plansmith
Manufacturing and retail have long used product management techniques to meet competitive pressures for pricing, product planning and growth strategies. For financial institutions to thrive in today’s highly competitive environment, management must understand and control all components of profitability. While margin and equity risks have been addressed using regulatory rate shock methodologies, as well as stress testing of the loan portfolio, product profitability combines these concepts with an often-overlooked element of cost: overhead.
Before beginning a budget, finalizing any financial plan or setting in motion any actions for execution, it is imperative that management knows what cost structure they’re working with. Armed with this knowledge, the team will be able to identify opportunities, avoid diminishing margins and provide services in the most efficient way.
With this in mind, we advocate the development and use of a simple, yet highly effective product profitability analysis. The data needed is easy to obtain and manage within your existing planning process.
A Simple Yet Effective Product Profitability Analysis Process
To begin, you’ll need to assign an overhead cost factor to all interest-bearing product lines. This percentage represents the basis point adjustment deducted from an account’s gross yield.
Next, determine if there are other factors affecting your product line’s interest rate that should be noted. For example, consider costs associated with loan losses or additional income contributions for fees or service charges associated with each product line but recorded separately on your income statement.
Last, and extremely important to your analysis, is to place your attention on the product line’s repricing frequency. As with all other risk analytics, matching funding by repricing frequency will be the starting point for funding allocations.
Building Your Product Profitability Report
With this simple yet analytically rich information, you can then build an effective analytical report. Let’s review:
- Repricing frequency—duration or average life
- Current end-of-month Balance
- Current yield (fully tax equivalent)
- Net overhead adjustment
- Losses/fees
The Match Funding and Funds Pooling Approaches
As an example, at Plansmith, we use this information to produce an analysis in two formats: match funding or funds pooling. Let’s examine a match funding method.
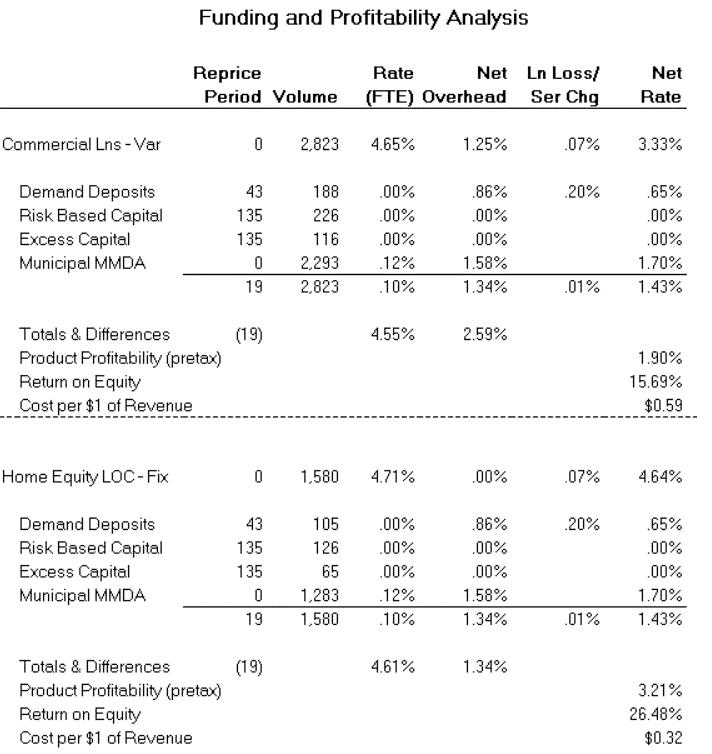
In the example above, assets are grouped by repricing frequency (duration), shortest to longest. Liabilities are sorted in the same manner. Plansmith distributes capital evenly to each product, thereby allocating free funds equally among all interest-bearing assets.
A “waterfall report” is then created as each asset is funded with liabilities until their volumes are matched. Any remaining liability balances flow into the next asset category. Yields and costs are adjusted for overhead, service charges, fees and loan losses, if applicable.
The importance of this approach is to identify each asset’s true rate, the true cost of funding that activity, and its true profitability.
It is not uncommon at this juncture for many to argue with the allocations. If this becomes the case within your financial institution, we suggest a funds pool approach.
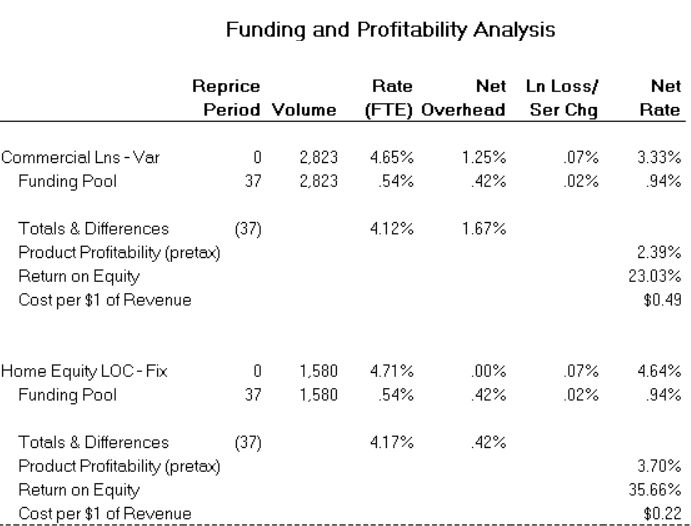
Funds pooling uses the same analytical methodology; however, it consolidates the funding liabilities into a pool. The pool rate remains consistent for all interest-bearing assets, eliminating arguments about liability allocation.
In either case, the end results are significantly informative to the financial institution. What is the true rate for the asset product category? What is its return on equity, and what is its cost per $1 of revenue? These are important insights that should be examined regularly, especially during times of economic shifts.
3 Ways to Use Product Profitability Information
There are three specific uses for product profitability information:
- Product strategy: Using this information in conjunction with the other factors leads to the most effective product mix for your community.
- Product pricing: By approaching pricing from the cost side first, the product manager can make the decision to consider cost reduction, market an alternative product or service, or possibly eliminate the product/service all together.
- Profitable growth strategies: Profitability reporting assists in choosing the appropriate product mix and marketing programs to promote the credit union’s most profitable services, while weeding out poor performers.
For your next budget meeting, we encourage you to go beyond a simple review of interest rates. Dig a bit deeper and examine your institution’s true rates using product profitability analytics. You’ve got nothing to lose but basis points.
A former banker, Susan West is president of CUES Supplier member Plansmith. With more than 40 years of budgeting and interest rate risk management experience, she’s helped coach and cultivate both an acclaimed customer service team and thousands of powerful client users. Her goals are to demystify planning and ALM so all users can benefit from the ability to make better informed business decisions by using sophisticated yet easy-to-use software.