
10 minutes
2023 CUES Executive Compensation Survey shows strong growth, especially among the top positions.
Strong, but not as strong as last year. That’s the major takeaway from the 2023 CUES Executive Compensation Survey, which measures base pay, base plus bonuses and total compensation for top positions in the credit union industry. This year’s survey recorded solid increases, but it has a tough act to follow; the 2022 survey showed phenomenal growth in executive salaries, bonuses and total compensation that hadn’t been seen in decades.
Last year’s survey, which tracked salary data for the year ending Jan. 1, 2022, showed average pay increases topping 8% across nearly two dozen executive titles. Those figures were indicative of rising compensation levels for the labor force as a whole. In mid-2022, CNN Business reported that the “white-hot labor market” had driven up wages by 6.2% over the past year, a faster clip than at any time since the mid-1980s. However, inflation at that point eclipsed those advances, growing briskly at an annualized rate of 8.3%.
 Fast-forward a year later, and inflation has cooled to an annualized rate of less than 3%. Wage increases have moderated too, but at an annualized rate of 4.4%, workers are experiencing real gains in their purchasing power for the first time in over two years, according to CBS News. In this year’s compensation survey, which tracked data for the year ending Jan. 1, 2023, the average increase had fallen a percentage point or two from the averages of the year before.
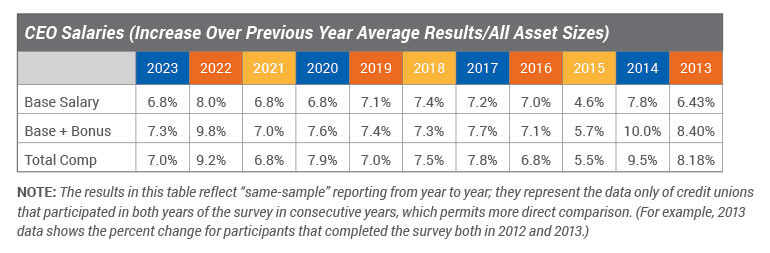
“Historically, 3% to 4% has been the year-over-year growth for same sample,” says Scott Hackworth, president of Industry Insights, Dublin, Ohio, CUES’ partner in conducting the annual executive compensation and employee salary surveys. “Right now, we’re seeing 6% to 8% increases across many of the positions. That’s still elevated, but it is coming down from the double-digit growth we saw across many of the positions in 2021.”
Top Spots, Top Gains
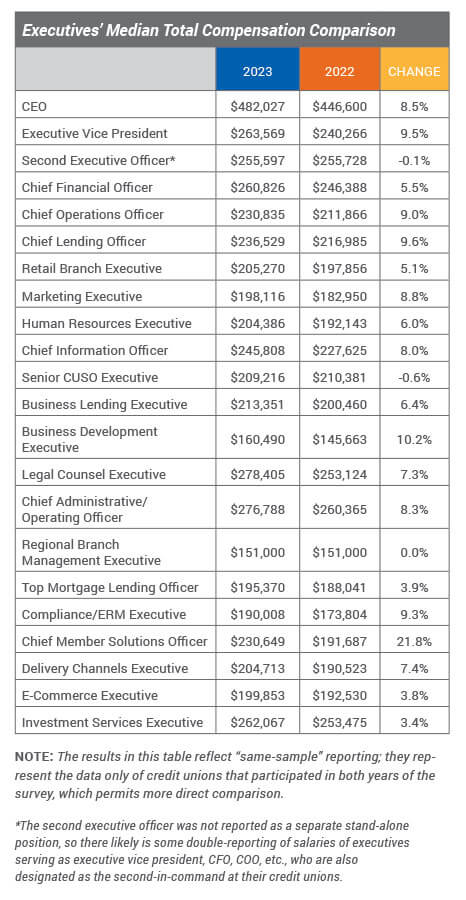
This year’s survey recorded some increases that were equivalent to or greater than what was seen last year, especially among the highest leadership roles. “For top spots, like CEO, there’s still the feeling that ‘We need to keep our top people.’ So, for CEOs, we’re seeing median increases in the range of 8% to 8.5% (for base plus bonus and total compensation),” Hackworth reports.
Other senior executive positions likewise experienced robust increases this year. The median increases in total compensation that were particularly strong include:
- executive vice president—9.5%;
- chief operations officer—9.0%;
- chief lending officer—9.6%;
- chief administrative/operating officer—8.3%; and
- chief information officer—8%.
“For top positions, anywhere north of 6 or 7% is pretty solid,” says Hackworth. “These increases show that there’s still a desire to keep these top people in place. In a lot of cases, these increases are board-driven, indicating that boards want to keep their key people in place and are willing to provide higher incentives to do that.”
Below these top-level positions, most other positions saw smaller increases than last year. “It will be interesting to see what happens to compensation levels in 2023,” Hackworth notes. “Will the rate of growth continue to soften? That’s what we expect, but we still believe the numbers will remain relatively high.”
A Positive Picture
The annual CUES Executive Compensation Survey collects compensation data across 23 credit union titles, with 22 roles providing sufficient data to provide a same-sample trend analysis in 2023. This year’s survey represents input from 300 CUES member and nonmember credit unions. Of the 22 positions in the same-sample comparison, 20 experienced an increase in base salary, base plus bonus and total compensation when comparing 2023 to 2022. Median total compensation increases ranged from -0.6% for senior CUSO executives to 21.8% for chief member solutions officer.
Overall, the compensation levels present a positive picture for those who make their living as a CU executive. “This year’s survey shows that the median and average compensation levels for most executive positions have crossed the $200,000 mark,” says Matt Shefchik, assistant vice president with Carlson Dettmann Consulting, Madison, Wisconsin. “The growth we’re seeing in many of these executive pay levels, I think, is a response to the success that many credit unions saw in 2022 going into 2023.”
A year ago, when commenting on the 2022 study, Shefchik referenced the “hyperactive compensation growth” that was happening in the CU space. This year, he observes, “While there’s been a slight tapering off, these increases are still very strong compared to historical figures. I think we’ll see increases slow as we go from ’23 into ’24, but the increases will still be elevated compared to pre-pandemic levels.”
In studying the data, Shefchik found some interesting correlations between higher pay increases and positions dedicated to enhancing the member experience. “For instance, the chief member solutions officer saw a big median increase of 21.8% in total compensation and nearly 14% for base pay,” he says. “We saw some of that strength play out in the average increases for the position as well.”
Another position experiencing above-average increases is the delivery channels executive, which experienced strong base pay increases of 9.3% (median) and 10.3% (average), while total average compensation rose nearly 14%.
“We’re seeing these positions more in larger credit unions, and they’re indicative of the greater focus that credit unions are putting toward taking care of their members,” Shefchik says. “We saw significant shifts in how members want to interact with their credit unions as an outcome of COVID, using more remote transactions and less brick-and-mortar. It’s nice to see credit unions moving in that direction and rewarding those positions that are centered around providing greater member satisfaction.”
Economic Influences
This year’s report makes note of several economic factors that are playing a role in compensation levels, including:
Economic Slowdown: Economic growth slowed in 2022 and is expected to slow even further in 2023 as the Federal Reserve implements tighter monetary policy, including raising interest rates, to curb inflationary pressures. However, unless the economy goes into a recession, Industry Insights predicts that employees should continue to see average wage increases in the 4% to 5% range.
“The Federal Reserve took swift action to tighten monetary policy throughout 2022 and into 2023,” Hackworth says. “I think we’ll see them raise interest rates once more to try to get inflation down even further.”
Inflation: In addition to rising interest rates, several other factors should slow down inflation over the next few years, including less federal government stimulus and the resolution of many supply chain issues that began during the pandemic. While inflation this year is declining from its 2022 peak, it is still predicted to exceed the desired levels set by policymakers in 2023.
Turnover Rates: Last year’s historic compensation increases were largely fueled by fear among employers that their top-quality talent would leave for better compensation elsewhere. Employees were leaving their employers in droves, as part of a phenomenon known as “the Great Resignation,” which resulted in a national quit rate of 33.6% in 2022, based on annualized data from the U.S. Bureau of Labor Statistics. In total, over 50 million workers quit their jobs that year, setting a record in the United States.
 “Some of that fear of turnover has subsided, along with easing of inflation rates, which is reflected in the smaller raises being given as well in the bonus distribution,” Hackworth observes.
However, Shefchik notes that there are still concerns about turnover, especially with the increasing number of CEO retirements. “We’re seeing an aging demographic of credit union leadership, and along with it, the need for credit unions to secure their top-level talent and the rest of the C-suite from possibly being poached by another credit union,” he says.
Employment: The labor market has been steadily improving and has now reached pre-pandemic levels. Demand for labor is drastically outpacing supply. There are nearly twice as many job openings as there are unemployed individuals seeking employment, according to the Bureau of Labor Statistics. “The labor market shows no signs of slowing down,” Shefchik states. “I believe it will continue to be strong through 2023 and into 2024.”
Key Findings
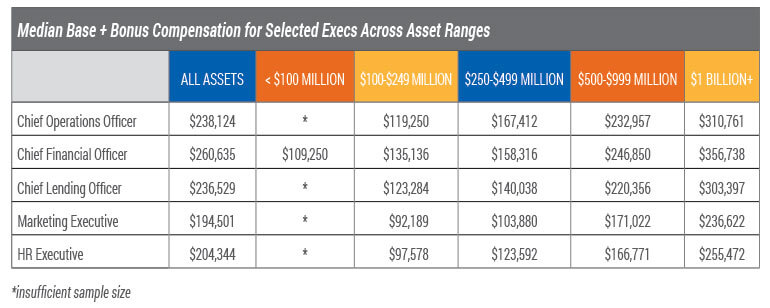
Like past surveys, this year’s report found that a credit union’s asset size is the leading influencer of compensation levels. “Larger credit unions tend to pay more,” Shefchik says. “If you have a younger, well-performing executive at a slightly smaller credit union, you need to be aware that larger credit unions may have the resources to recruit that individual away.”
Here are some additional findings in this year’s survey:
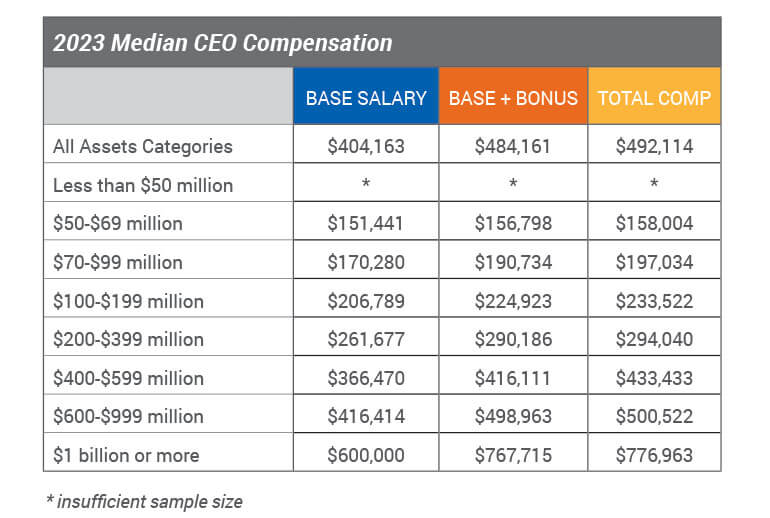
- Bonuses continue to be a strong component of executives’ total compensation. In this year’s survey, 93.1% of CEOs were reported to be eligible for bonuses (down slightly from 93.8% last year). The top four factors leading CEO’s bonuses were earnings, board evaluation, loan growth and membership growth.
- “Approximately 20% to 25% of their pay tends to be bonus-driven,” Hackworth says. “Bonuses are crucial to all executive level positions, but in particular to CEOs. The at-risk compensation plays materially into their total compensation levels.”
- Base salaries also experienced solid growth for top positions. Examples include an 8.3% median base salary hike for executive vice presidents and 11% for chief operations officers. “When you start seeing sizeable raises being applied to the base salary, that’s pretty significant,” Hackworth observes. “Again, that movement is mostly being seen at the higher levels, with base salary increases softening for most other positions.”
- Diversity and inclusion officers are not plentiful among survey respondents. There was insufficient data to include this position in the same-sample comparison chart. Moreover, the report noted that 24% of reported CEOs are female; 92% are white. For all executive positions surveyed, 85.7% are white, 4.2% Black/African American, 5.9% Hispanic, 0.4% American Indian/Alaskan Native, 0.4% Native Hawaiian/Pacific Islander, 1.2% Asian and 2.3% Other.
“It’s telling that we continue to see a lack of representation in the executive ranks by minority groups and there also are insufficient organizations reporting data for DEI officers,” Shefchik says. “That indicates that continued efforts need to be made to move toward better representation.”
Using the Data
Shefchik recommends that credit unions explore this year’s survey for figures that are relevant to their asset size. “As interesting as it is to talk about figures for the entire group, small credit unions tend to want to compare themselves to small credit unions, and large credit unions want to compare themselves to large credit unions,” he says. “Using the online tool and data tables is critical to ensuring that they’re accurately defining their market.”
Hackworth recommends making use of the compensation calculator that is available to CUES Executive Compensation Survey subscribers. The calculator will allow subscribers to input various attributes, such as their credit union’s asset size, member size, number of employees, location and size of their community, as well as specifics about the individual employee’s education and experience level, to determine specific pay levels.
“Based on a regression formula that our team built, [the calculator] will render the expected compensation based on your selected factors,” Hackworth explains.
Readers who are interested in digging further into this year’s results can purchase a subscription to the survey at cues.org/ecs. Subscribers can view the report and review the results on a more granular level by accessing the online reporting tools in the research portal on the same page. (CUES Unlimited+ membership includes access to this report and the CUES Employee Salary Survey as a member benefit.) cues icon
Based in Missouri, Diane Franklin is a longtime contributor to CU Management magazine.