3 minutes
Four scenarios to test
Many are celebrating that rates are finally moving up, but there is plenty of uncertainty to go along with the shift. Just last September, half of the Federal Open Market Committee members expected a rate hike in 2022 and half didn’t. Inflation was forecast at 2.3% for 2022. To say things have changed is an understatement. And with far higher inflation and a war in Ukraine, today’s expectations could be just as fleeting.
Preparing decision-makers for a range of different outcomes is key. Here are four scenarios to run (if you haven’t done so already) that capture some of the less-expected situations.
1. Loan Pricing Doesn’t Move as Anticipated
Given all the change, many are looking at budget and other financial reforecasts and what-ifs. Be sure to include loan pricing that doesn’t move in lockstep with market rates. Consumer loan pricing can be influenced, not only by market rates but also by the amount of liquidity in the system and demand for loans. Currently, demand for autos remains high, but their lack of availability has resulted in low demand for loans, causing downward pressure on loan rates. What happens if consumer loan rates only increase 50% of the market movement or if rate increases lag for a year?
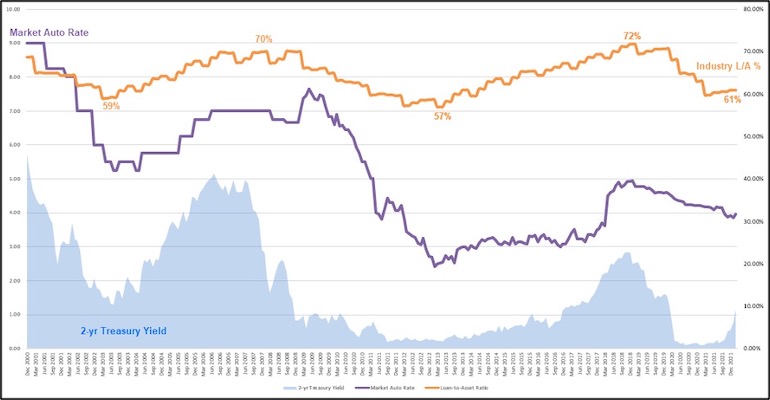
Looking at history can help reinforce the fact that market rates are not the only driver of consumer loan rates.
2. Market Rates Decrease
One of the biggest wild cards is the war in Ukraine, which could cause far more than just unexpected market rates. Already-disrupted supply chains are taking another hit. COVID-19 variants are a distinct possibility. Take some time to think through what this could look like and run some what-ifs to see how your structure holds up under those pressures.
3. Flight to Safety
The stock market isn’t as enticing these days; further deterioration is one potential cause for a flight to safety. What would your structure and profitability look like with another influx of funding?
4. Tight Liquidity
This probably sounds refreshing to many, but it’s not too soon to think about it. If we combine a few factors like no additional government stimulus, continued high levels of spending on goods, and having to spend more due to inflation, those fat savings accounts could get a lot thinner quickly.
Gasoline was about $3/gallon a year ago, and it’s about $4.40 today as this is written in mid-March. Let’s estimate the impact on consumers if it goes to $5.00/gallon:
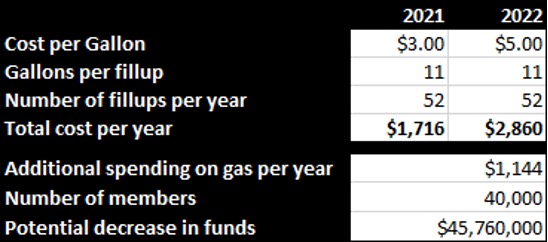
For a credit union with 40,000 members, that could mean your membership has about $46 million less to save. That’s just gas. Housing is also having a large impact.
Another factor that could squeeze liquidity is how much is tied up in investments. Over 34% of credit union investments are longer than three years.
It’s a fine balance to maintain your optimal balance sheet structure and profitability as you strive to provide members with exceptional benefit in a changing environment. What was unexpected just a short time ago can quickly become reality. Thinking through some of the less-expected scenarios and running a variety of what-ifs to see how your structure holds up can help you prepare for a wider range of outcomes and meet the challenges.
C. myers helps financial institution decision-makers uncover opportunities and continuously optimize their business models. Their depth and range of experience in linking strategy, talent, desired financial performance and successful execution enables them to work with their clients as strategic collaborators. They have the experience of working with over 600 financial institutions, including 200+ of those over $1 billion in assets. C. myers helps financial institutions think to differentiate and drive better decisions through strategic planning & business model optimization, strategic solutions and implementation, strategic leadership development, real-time ALM and financial forecasting, education, and thought leadership.
Sources of data in this article: Treasury yields and market auto rates are from internal c. myers historical data. The auto rates were originally pulled into our internal data from bankrate.com. Loan-to-asset ratios and the percentage of assets in investments with terms great than three years are from Callahan. US Retail Gas Price. US Dept of Transportation: 577 gallons per vehicle annually.