

10 minutes
Executive compensation continues to grow, but the roles with the greatest gains might surprise you.
As the world works toward a sense of normality following the massive disruptions caused by the pandemic, demand for top talent across industries continues to rise. Employers struggled to fill key credit union positions prior to the pandemic, but those struggles have been amplified, with many employees choosing to leave the workforce or seeking better job opportunities.
The risk of losing talent is of particular concern when it comes to those in the senior leadership roles—the CEO and the entire C-suite. Credit unions benefit from their strong mission and member focus and thus have traditionally been considered attractive employers by many in the financial services space. But competition is growing, driven by the ability for remote/hybrid work and the emergence of myriad fintech companies. Competition for talent exists not just across the street or down the block but anywhere around the world.
Salary, of course, is a crucial element in keeping key executives on board and attracting and hiring top talent when openings occur.
According to Pew Research, the majority of individuals changing jobs in the U.S. see “real wage gains” when they do so. As such, it’s important for credit union leaders to be cognizant of how their compensation practices may be impacting attraction and retention, especially for those in key leadership positions. The 2022 CUES Executive Compensation survey is a great resource to help you do just that.
Economic Impact on Compensation
Inflation and interest rates are on the rise. Post-pandemic, the demand for labor has far outpaced labor supply, which has created an environment of increased wage pressure. And there are various risks that could further impact the economy in 2022 and the coming years—new variants of COVID-19, continued supply chain issues, tighter fiscal policies, geopolitical events and so on.
These can all impact compensation considerations for credit unions. But despite a rather dismal economic outlook after several years of slow and steady growth—an economy that many are claiming is in recession—executive salaries in the 2022 CUES Executive Compensation Survey largely continued the upward trend seen in the 2021 survey. In fact, according to WTW, “the United States is projecting an average increase of 4.1% in 2023, which is aligned with the 2022 average actual increase of 4%—the highest since 2008—and higher than 3.1% in 2021 and 3% in 2020.”
The economy drives compensation decisions both in terms of what organizations can afford to pay and what they need to pay to be competitive. Industry data is key to shedding light on the latter.
The annual CUES Executive Compensation Survey collects data on the compensation levels and benefits packages of 23 credit union titles. This year’s survey was fielded in January 2022 via email invitation; responses were accepted through late April and represent input from 254 CUES member and nonmember credit unions based on their compensation data from Jan. 1, 2021, through Jan. 1, 2022.
“The survey is such a great tool for credit unions of varying sizes,” says Matt Shefchik, senior consultant with Carlson Dettmann Consulting. “The data is reported out in such a nice way that really helps to make pinpoint comparisons for a credit union of similar size. It’s a great resource.”
As always, the CUES Executive Compensation Survey reveals some key insights into credit union pay trends.
Total Compensation Up Across Most Roles
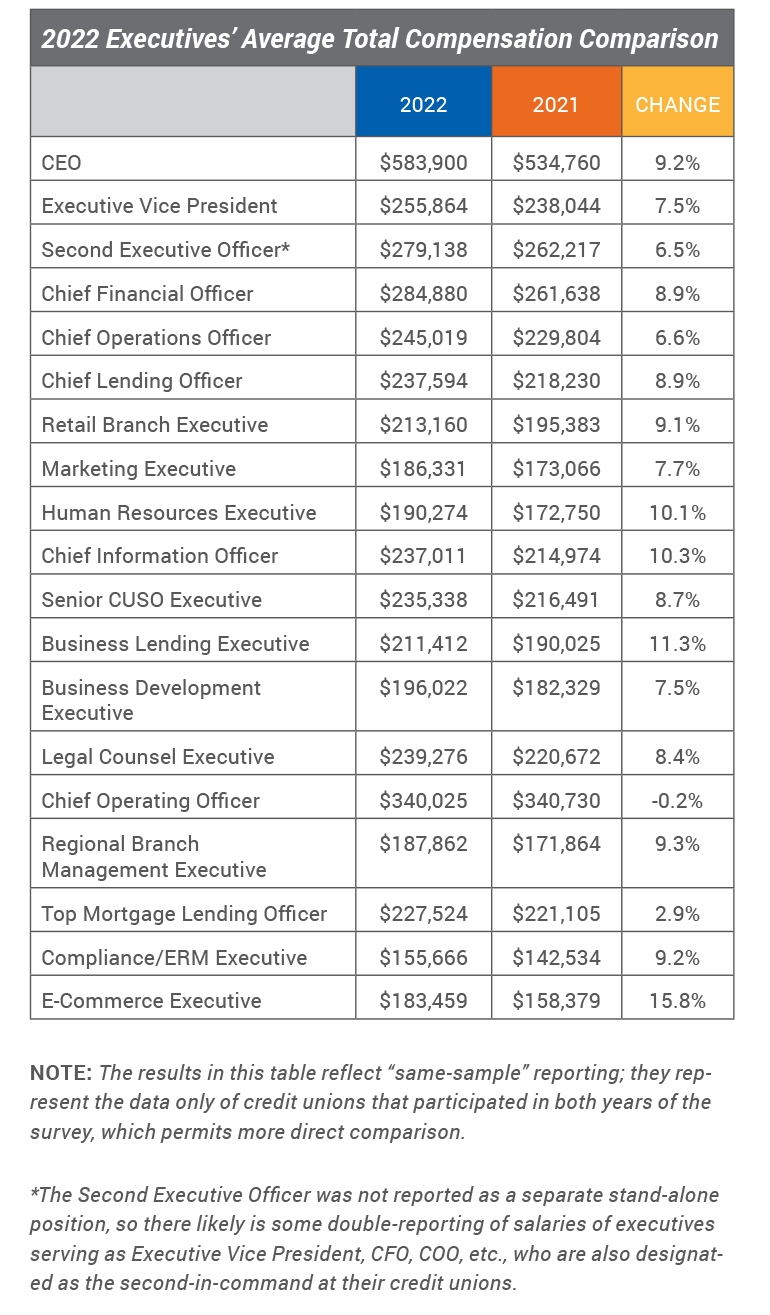
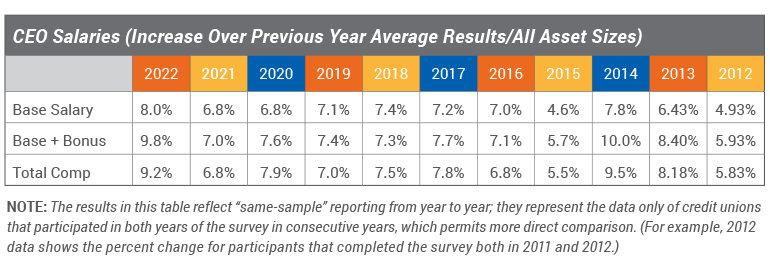
Salaries and total compensation are up for most positions this year. CEOs’ average total compensation rose by 9.2%, but they are far from holding the top spot in terms of percent increase; e-commerce executives saw the greatest average growth in total compensation at 15.8%. Rounding out the double-digits are business lending executives at 11.3% and—continuing their upward trend from the 2021 report—CIOs at 10.3% and HR executives at 10.1%.
Following closely behind in percent increase in average total compensation are:
- regional branch management executives—9.3%;
- compliance/ERM executives—9.2%;
- retail branch executives—9.1%;
- chief financial officers—8.9%; and
- chief lending officers—8.9%.
At the other end of the positive scale are top mortgage lending officers, with an average increase of just 2.9%.
The positive trend does not apply across the board. This year’s survey revealed a decrease of 0.2% in average total compensation for one role: chief operating officers. (Note: Chief operating officers serve in a different capacity than chief operations officers, who are also included in the survey. Chief operations officers direct and coordinate the operational activities of the organization. Chief operating officers often hold the No. 2 role in the credit union, assisting in its overall administration.)
This slight drop in total compensation comes even as chief operating officers saw a 9.6% average increase in base salary plus bonus in the 2022 report. That isn’t to say all COOs experienced a decrease in additional compensation from executive benefits over the past year; the median total compensation for this role rose by 12% between 2021 and 2022. But such an increase does not appear to be typical.
“When comparing median data on same sample sets, we need to be a little cautious when interpreting differences from one year to the next,” warns Dave Piper, VP/operations at Industry Insights, the firm that conducts the annual compensation surveys for CUES. “Statistically, the median represents the mid-point of the data, with half the data points above and half of them below. Median data comparisons year over year are more likely to see anomalies in the data that you don’t otherwise see when you look at the averages of the same sample.”
While 23 executive level positions were explored in this year’s survey, only 19 had adequate responses to be reported in the year-over-year comparisons. Chief member solutions officer, delivery channels executive, investment services, and diversity and inclusion officer had an insufficient number of respondents providing data in both 2021 and 2022 to be included.
The chief D&I officer is a new addition to the report this year in terms of overall compensation, notes Piper. This role had the lowest average base salary and total compensation at $120,669 and $137,138, respectively. It will be interesting to see how these numbers trend in next year’s report.
The role of digital services is also one to watch as credit unions continue to expand the use of online banking and tools—and, potentially, as remote or hybrid work continues.
Shefchik says he saw the importance of digital services in the credit union environment increasing last year. That has continued this year and is reflected in the total compensation increases for positions like e-commerce executives. Credit unions are asking, “What are we doing for our members, how are we communicating with our members, and how are we reaching them in different ways than brick and mortar retail environments?” and adjusting compensation for leaders in those areas accordingly, he notes.
‘Hyperactive’ Growth
“What we’re seeing in this survey, and what we’re seeing out there in reality, is hyperactive compensation growth in the credit union space,” says Shefchik. This is also true in other industries, he adds.
Piper agrees, noting that looking back over the last couple of years, credit union compensation increases were around 5%. This year they averaged 8.3%—“a pretty significant jump,” he says.
“There is some sense in the universe that credit unions want to keep their people happy,” Piper reflects. “It’s harder to find people.”
While credit unions have long been concerned about their frontline staff and wages moving dramatically at the lower ends of the wage scale, now “we’re seeing the same effect at the upper ends of the wage scale,” Shefchik says.
Shefchik speculates about one of the reasons CEO total compensation growth didn’t lead the pack this year: “CEOs are understanding what’s happening out there in the market and adjusting compensation for their team as needed to secure talent in a highly competitive environment to retain that talent.”
It was also a good year for incentives, he notes. “We’re seeing total cash compensation move at a quicker pace than base salary, meaning incentives were a little bit more generous in this last year than we previously saw.” It will, he says, “be interesting to see if that continues next year.”
Piper also points to a shift toward using bonuses this year as a key finding. “Salary increases are relatively flat,” he says. That doesn’t mean that salaries are staying flat, but in terms of percent growth, “we’re seeing a little more shifting toward the bonus structure that has been going on for a few years—more compensation is going toward the bonus and a little less toward the salary.”
There were a lot of changes in the market this year, some that are still playing out, including multiple interest rate increases throughout the year that impact executive benefits. “A lot of the expectations that credit unions had to start the year may look different now,” Shefchik notes. “Boards may want to consider discretion in their incentive awards” and potentially reevaluate the metrics of their incentive plans.
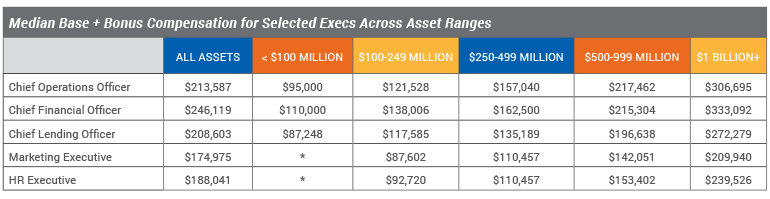
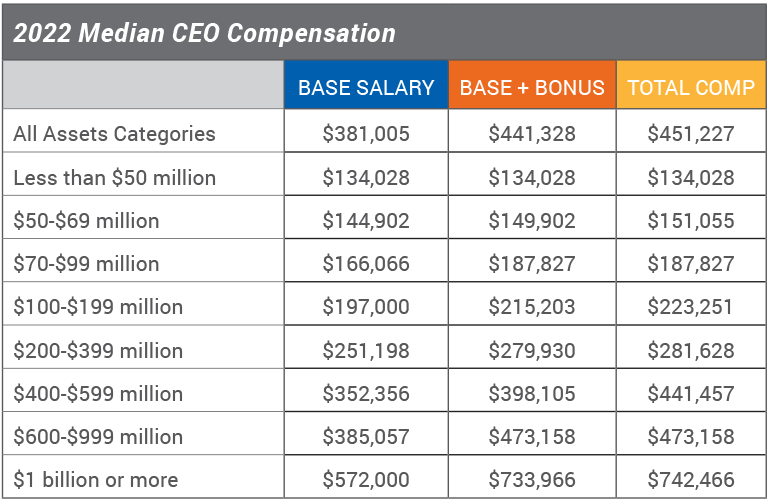
Asset Size Continues to Drive Compensation
Past survey results have shown a relationship between CEO compensation levels and the asset size of their credit union; the results this year tell the same story. CEO compensation levels increase at the base salary level, base plus bonus level and total compensation level as the asset size categories increase.
The average base salary for all asset sizes this year was $407,914, with an average base plus bonus of $496,753 and average total compensation of $515,602. From an incentive standpoint, the top three determining factors for bonus/incentive awards for CEOs were board evaluation (61.1%), earnings (60.2%) and loan growth (51.3%). These were the same top drivers noted in last year’s report. And, as with last year, impacts drop off sharply from there, with the next greatest factor being membership growth at 34.4%.
Compensation Planning in Changing Times
Shefchik predicts that the labor market will continue to be increasingly hot into 2023, even amid signs that a recession is looming. “There is just a lack of talent out there, and good talent will always be in high demand,” he says. And “[top talent] know they can be rewarded if they switch jobs.” Meanwhile, the labor market “continues to be really strong with unemployment continuing to drop and wages continuing to increase.”
A compensation debate that is raging as geography plays less of a role in hiring for many positions is whether to pay based on location or value. According to ChartHop, “employees in the same roles experience location-based pay differences anywhere from 3% for entry-level associates to as high as 90% for software engineering roles.” For example, if your credit union is located in Silicon Valley, but your newly recruited CHRO will continue to work from a small town in North Dakota, will you pay based on the same criteria applied in your main branch location or on market rates in North Dakota?
It’s a realistic scenario; Shefchik says he is currently working with a CU with a remote HR leader. “Before the pandemic, you would expect everybody to be in and around headquarters or traveling to branches,” he says. “I think we’re seeing CUs change … or have a little bit more of an open perspective to where they’re getting leadership talent.”
As this issue emerged last year, Shefchik noted that instead of location, credit unions may also choose to establish pay based on a national average. “There are pros and cons to each of those approaches,” he said.
Monitoring this and other compensation trends and challenges is critical for credit unions hoping to compete for top talent across the country.
The CUES Executive Compensation Survey offers a wide range of options for subscribers to analyze salary, bonus and benefit trends with peer credit unions in custom reports by asset size, region, field of membership, number of members, number of employees and other factors. In an environment of ongoing uncertainty, it’s important to be able to rely on solid data to help make critical compensation decisions.
You can request a copy of the executive summary of the survey report at content.cues.org/2022-surveys-exec-summary. Those interested in digging further into this year’s results can purchase or access the full report at cues.org/ecs. (CUES Unlimited+ membership includes access to this report and the CUES Employee Salary Survey as a member benefit.) You can also review the results on a more granular level using the online reporting tools in the research portal accessible from the same web page. cues icon
Lin Grensing-Pophal, SPHR, is a writer and human resource management and marketing communication consultant in Chippewa Falls, Wisconsin. She is the author of The Everything Guide to Customer Engagement (Adams Media, 2014) and Human Resource Essentials (SHRM, 2010).